Turn your launch strategy into a operating live app
The Go-to-Market Live App helps teams track pipeline, marketing performance, revenue movement, customer retention, outreach, and analytics in one connected workspace.
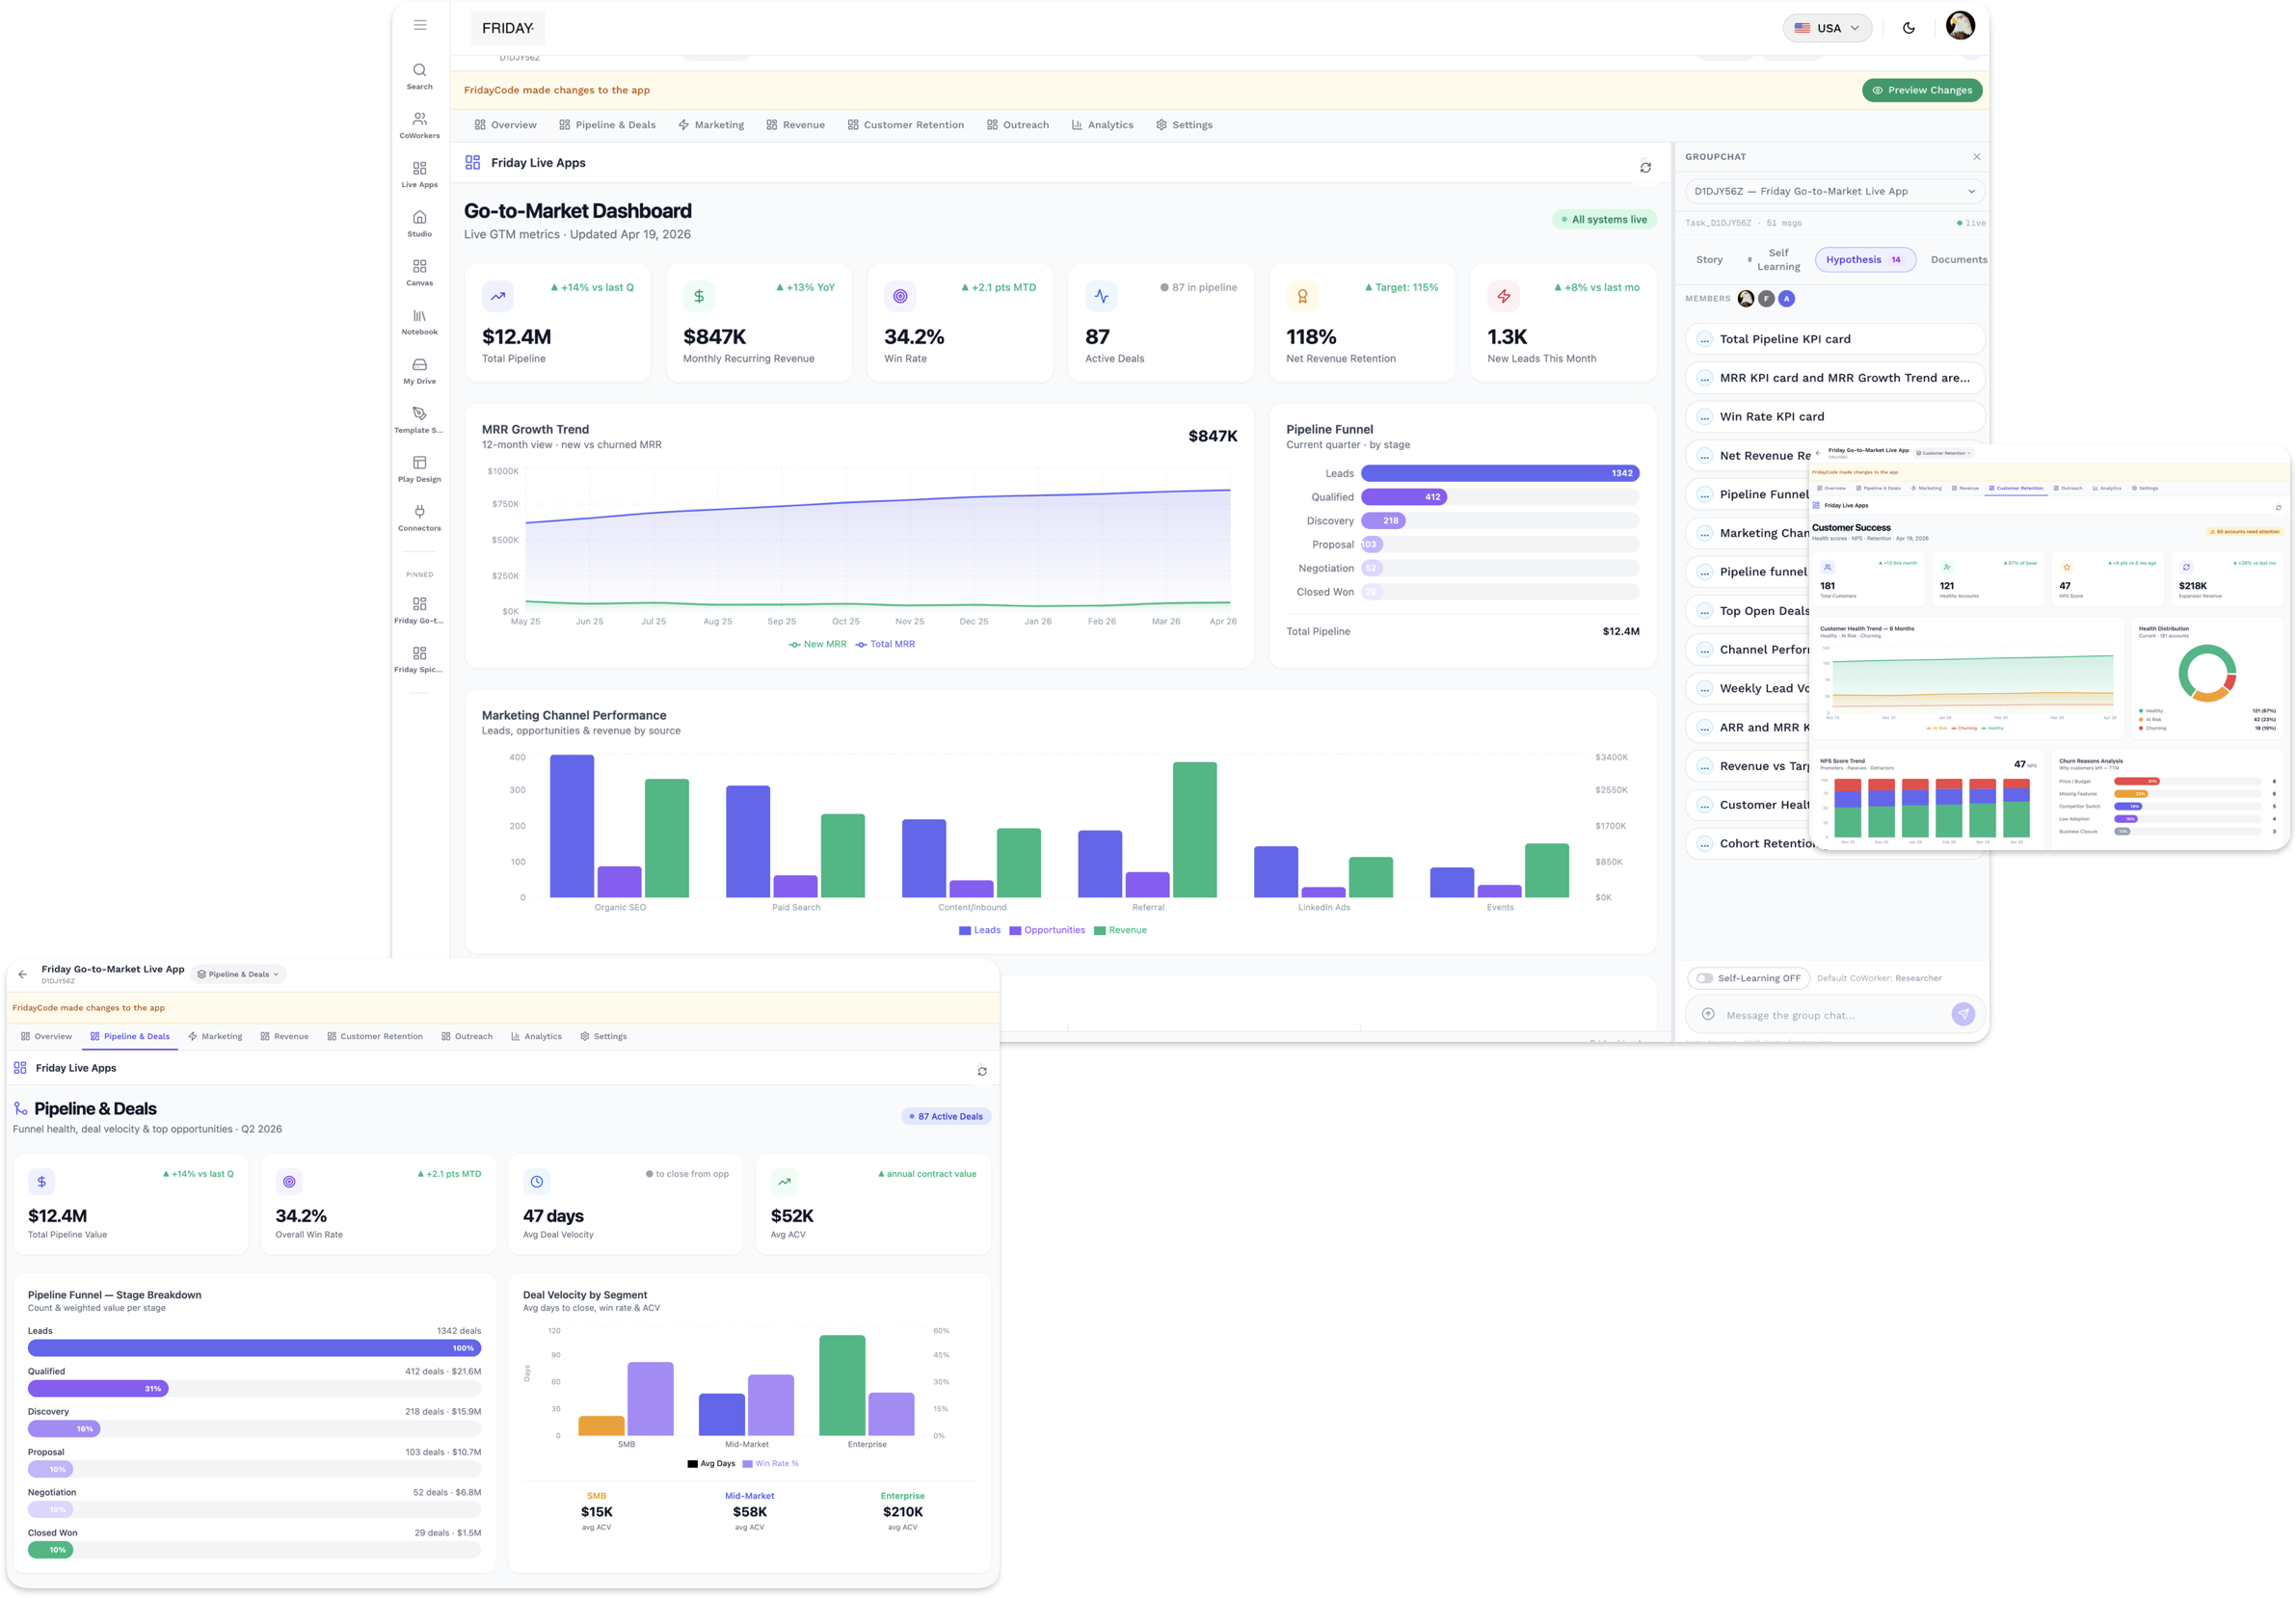
$12.4M
Total Pipeline
34.2%
Win Rate
1,342
Leads This Month
Run your go-to-market motion
from one live workspace
Friday Go-to-Market Live App brings pipeline, marketing, revenue, delivery, retention, outreach, and analytics into one connected view so teams can track performance, spot risks, and act faster.
See the full GTM picture in one view
The Overview dashboard gives leadership and GTM teams a live snapshot of pipeline value, revenue growth, win rate, active deals, lead volume, and customer health. It helps teams understand what is working, what needs attention, and where to focus next.
Track pipeline, revenue, leads, and retention together
See growth signals and risks at a glance
Align teams around one GTM source of truth
Prioritize the next actions with live metrics
Overview Live App
Track deal movement and funnel health
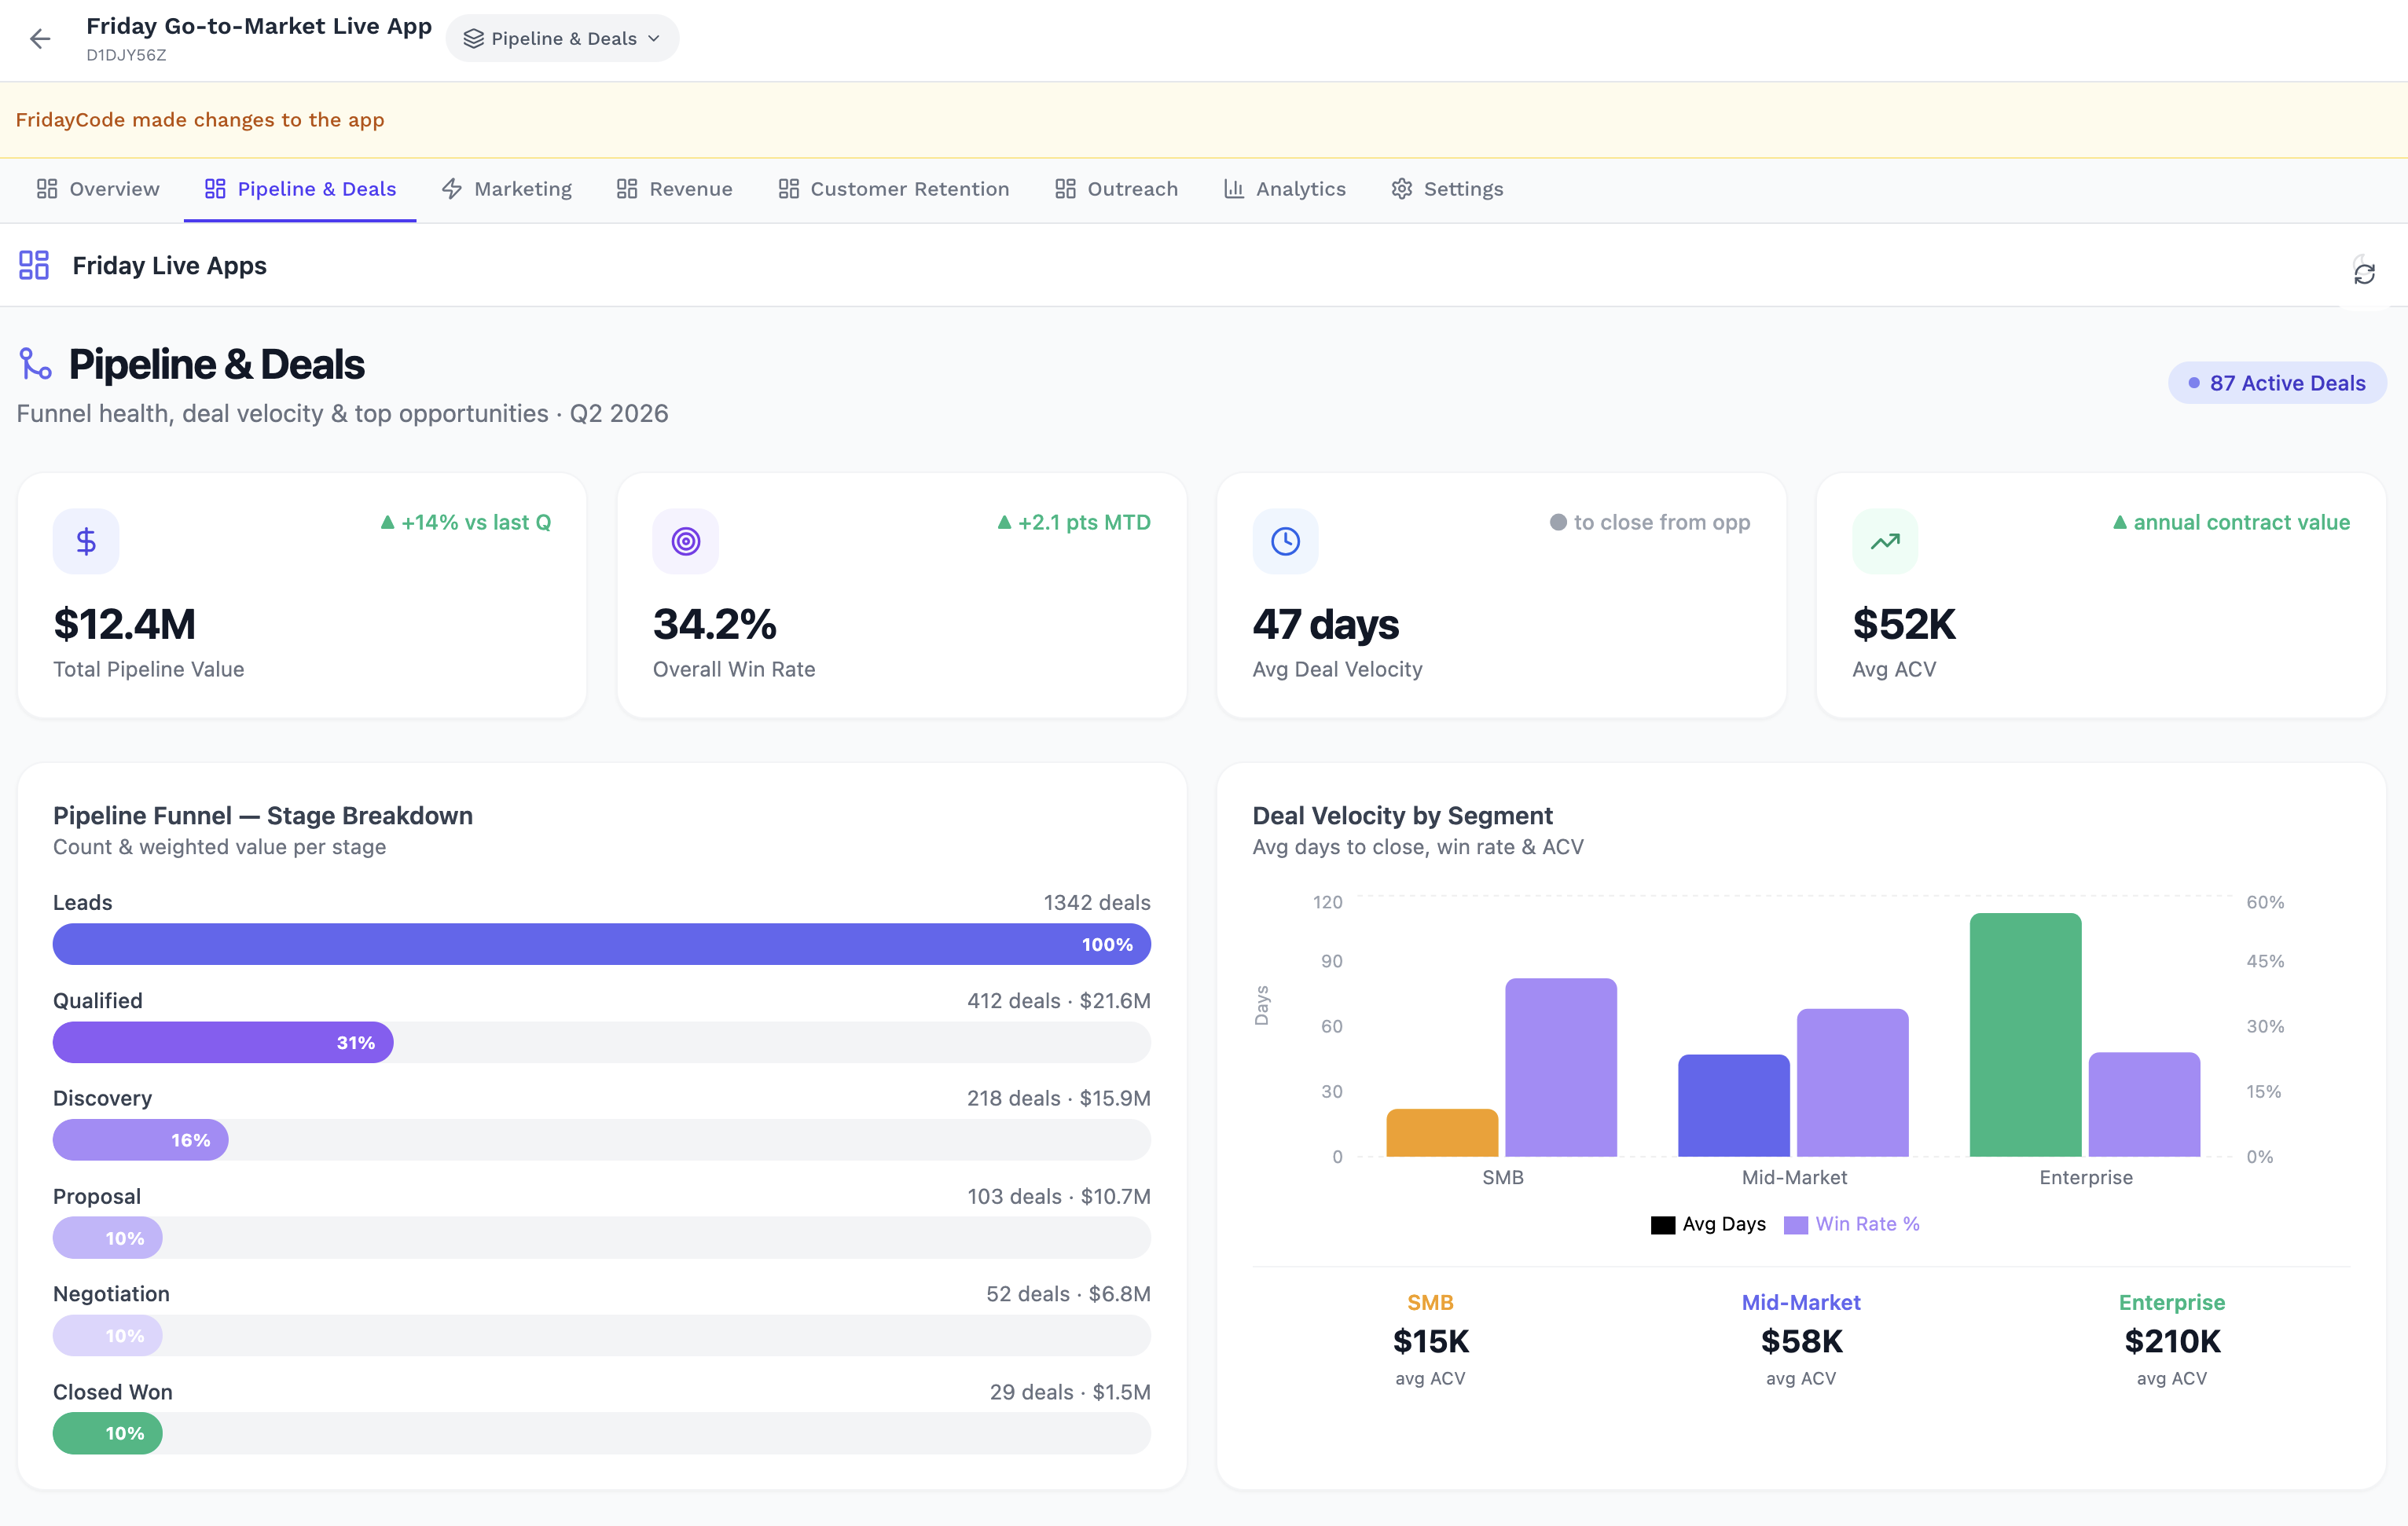
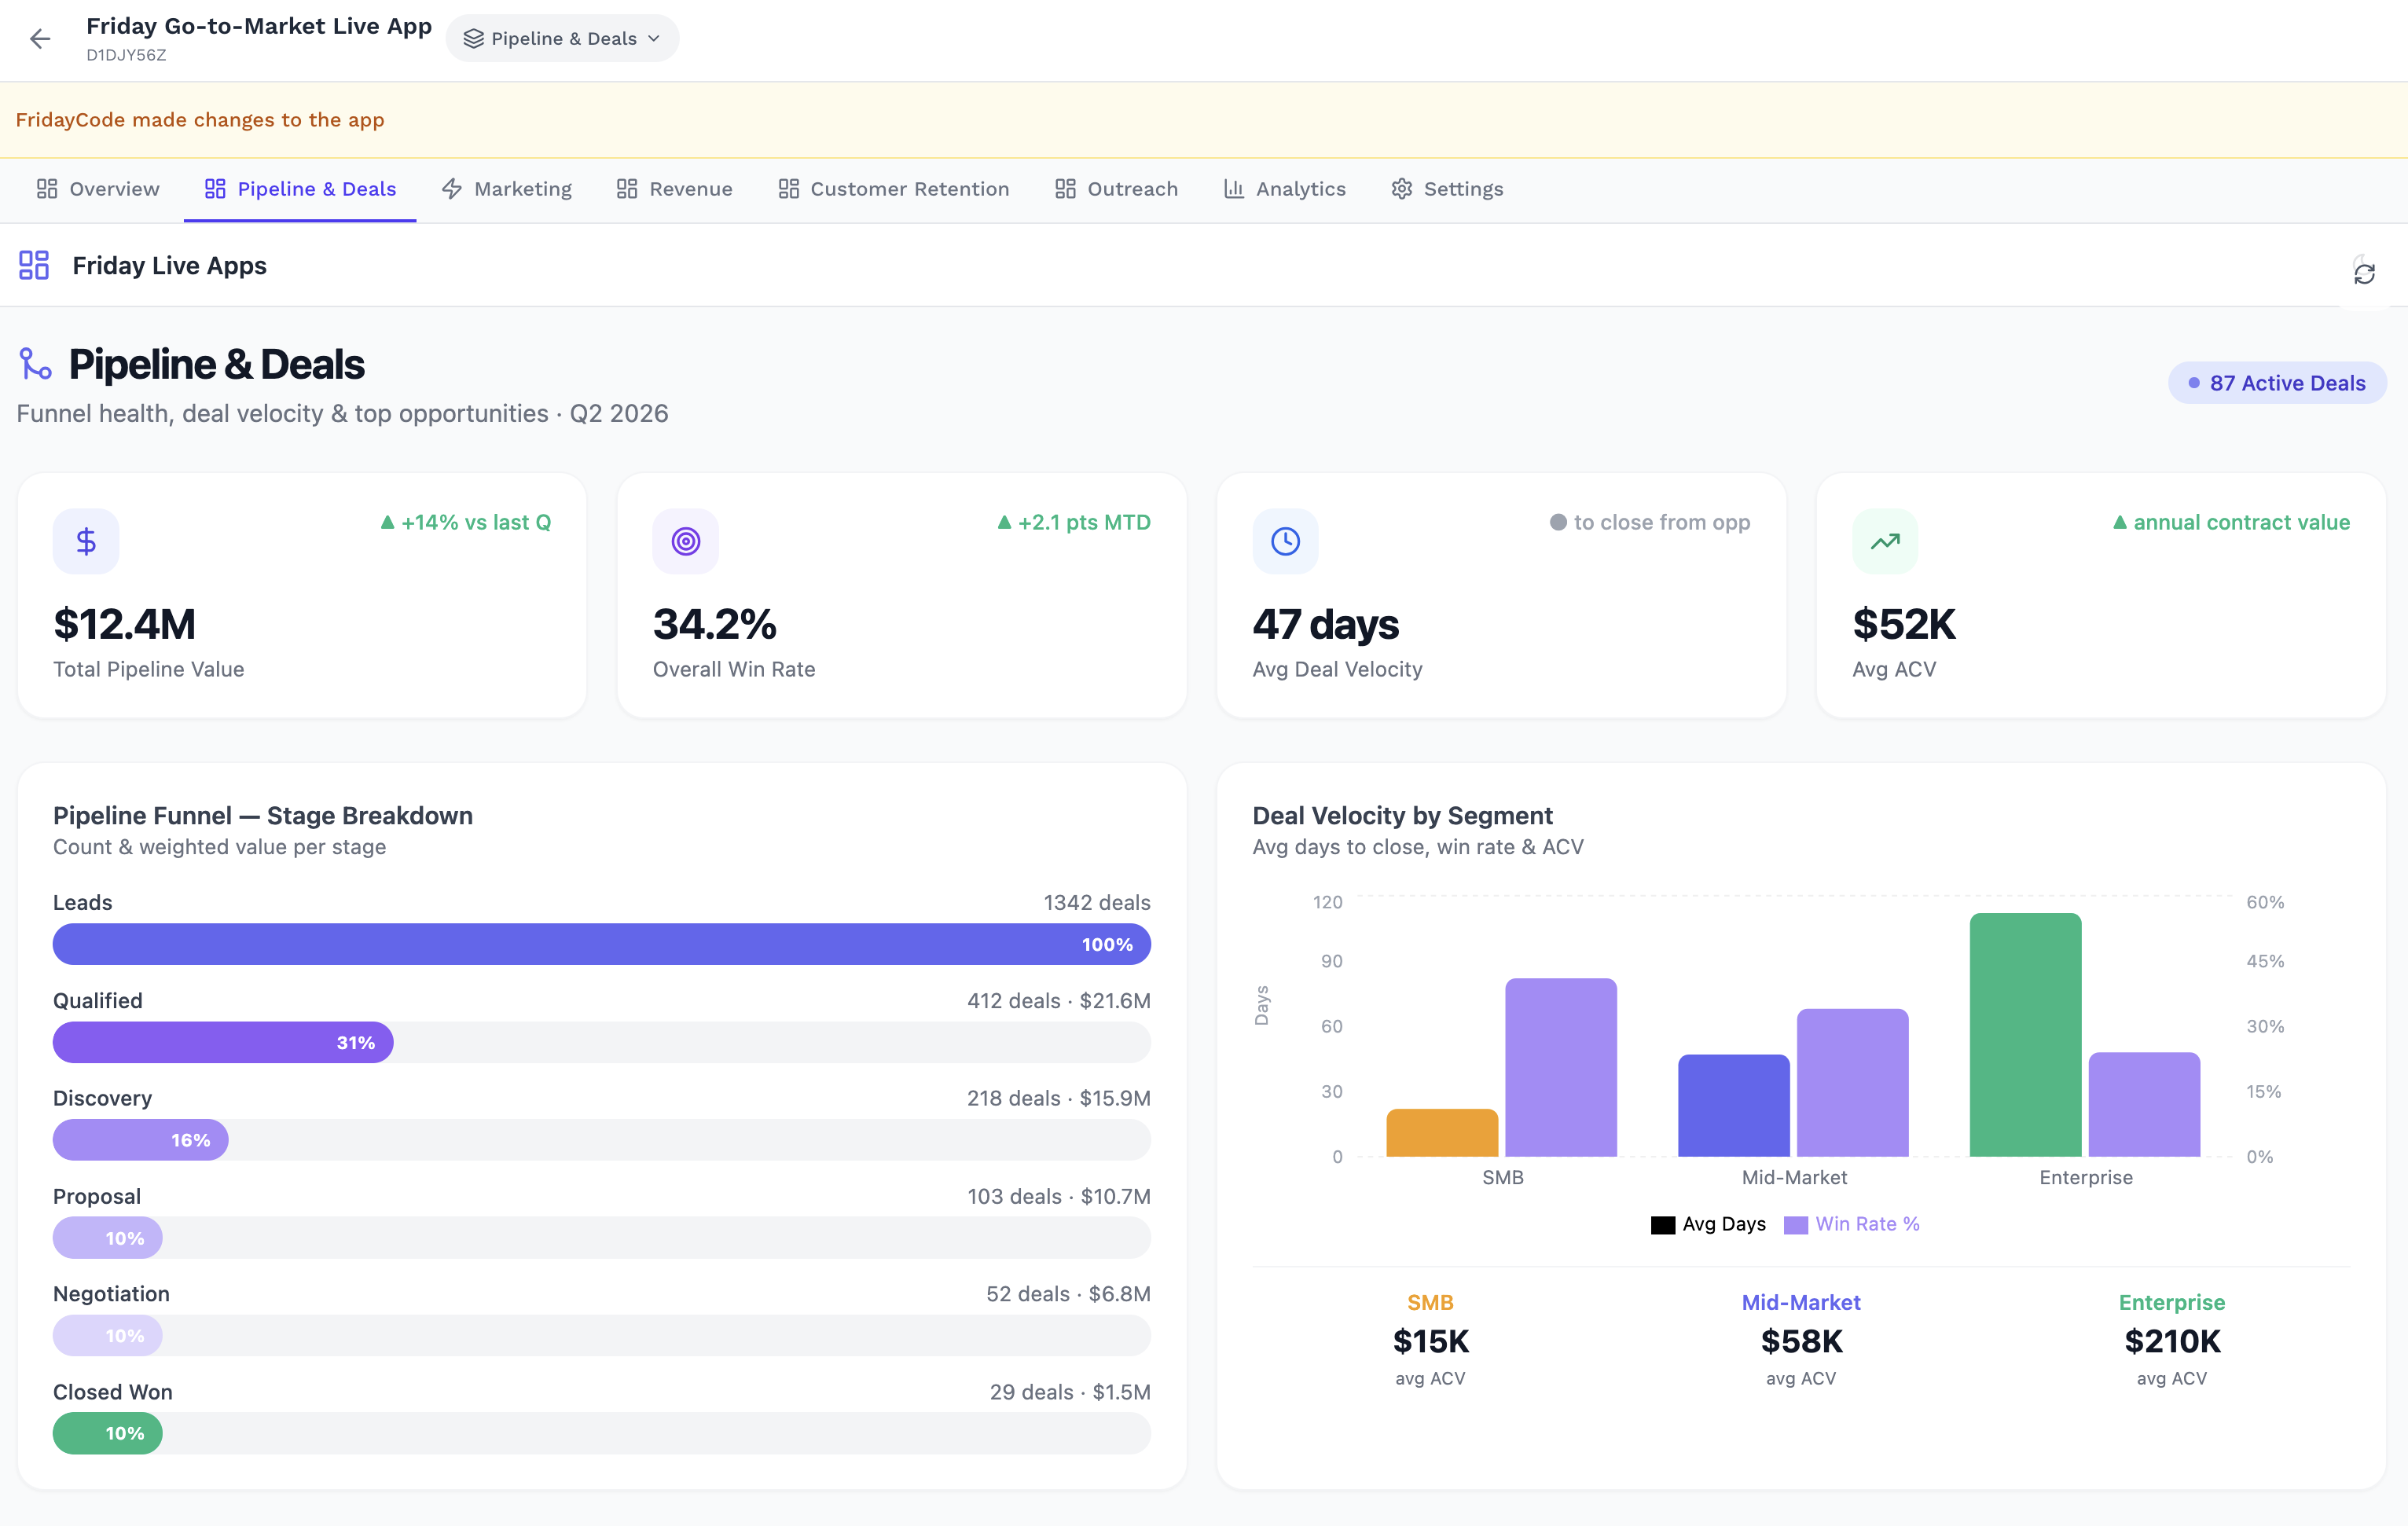
The Pipeline & Deals section shows how opportunities are moving across the funnel. Teams can monitor pipeline value, win rate, active deals, deal velocity, ACV, and stage breakdowns to identify where revenue is building or slowing down.
Monitor total pipeline value and active deals
Track win rate, ACV, and deal velocity
Identify weak stages before deals stall
Focus sales effort on the highest-value opportunities
Pipeline & Deals
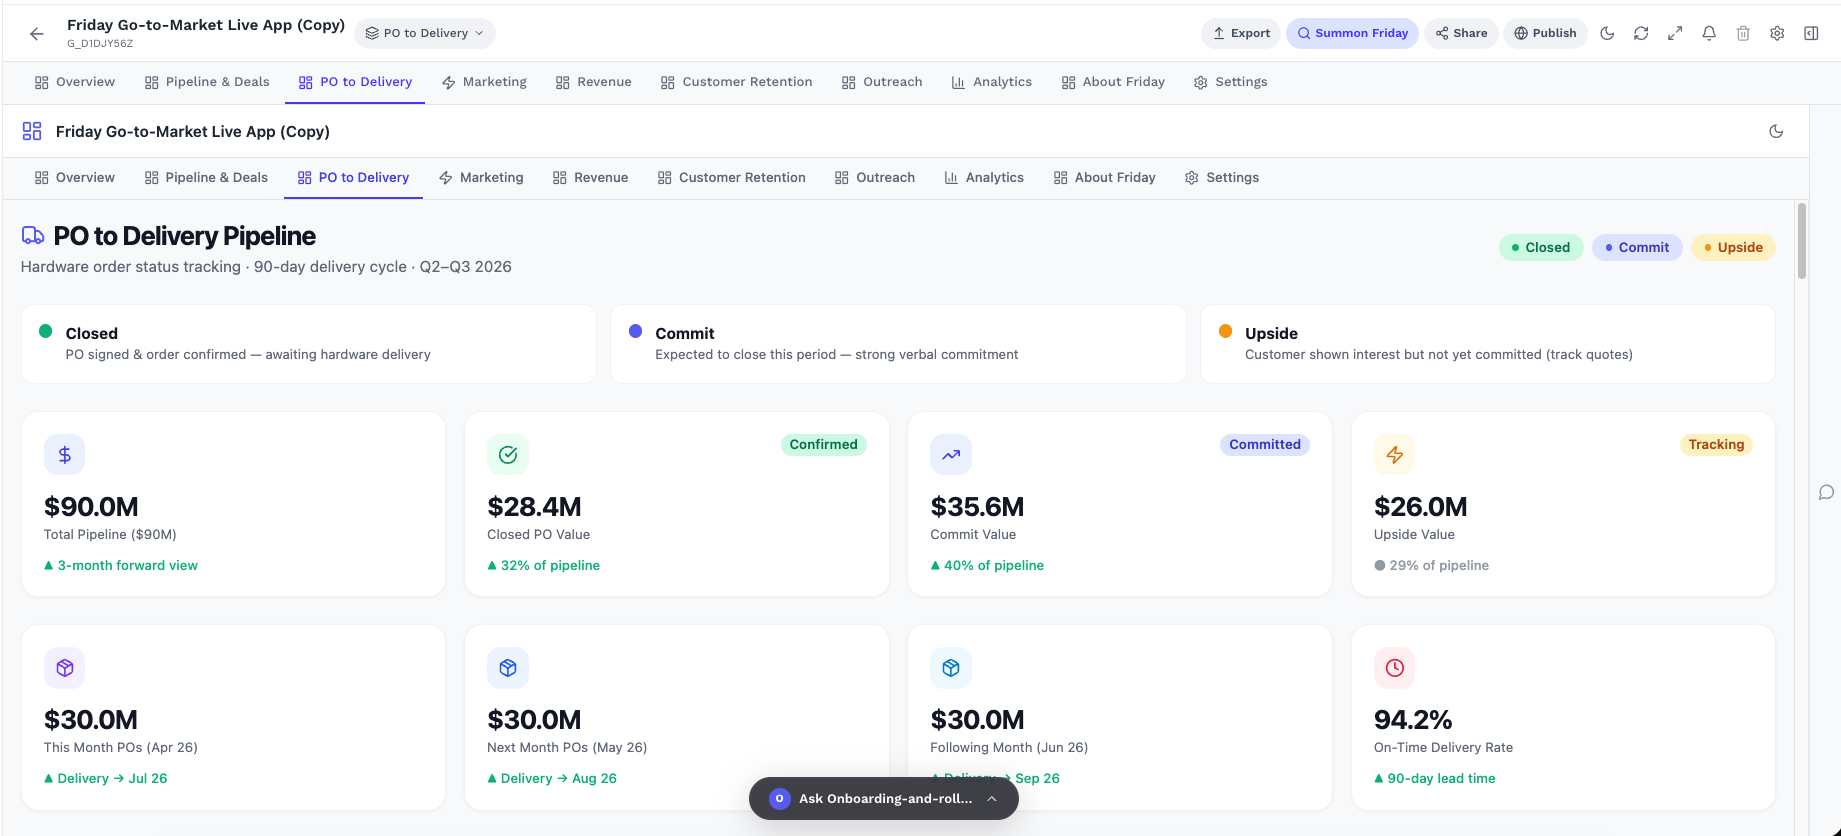
Connect signed orders to delivery execution
The PO to Delivery section helps teams track committed, closed, and upside orders from purchase order to customer delivery. It gives visibility into delivery value, timelines, on-time rate, and upcoming commitments so revenue execution stays predictable.
Track closed, committed, and upside order value
Monitor delivery timelines and on-time performance
Keep sales, operations, and delivery aligned
Spot delivery risk before it affects customers
PO to Delivery
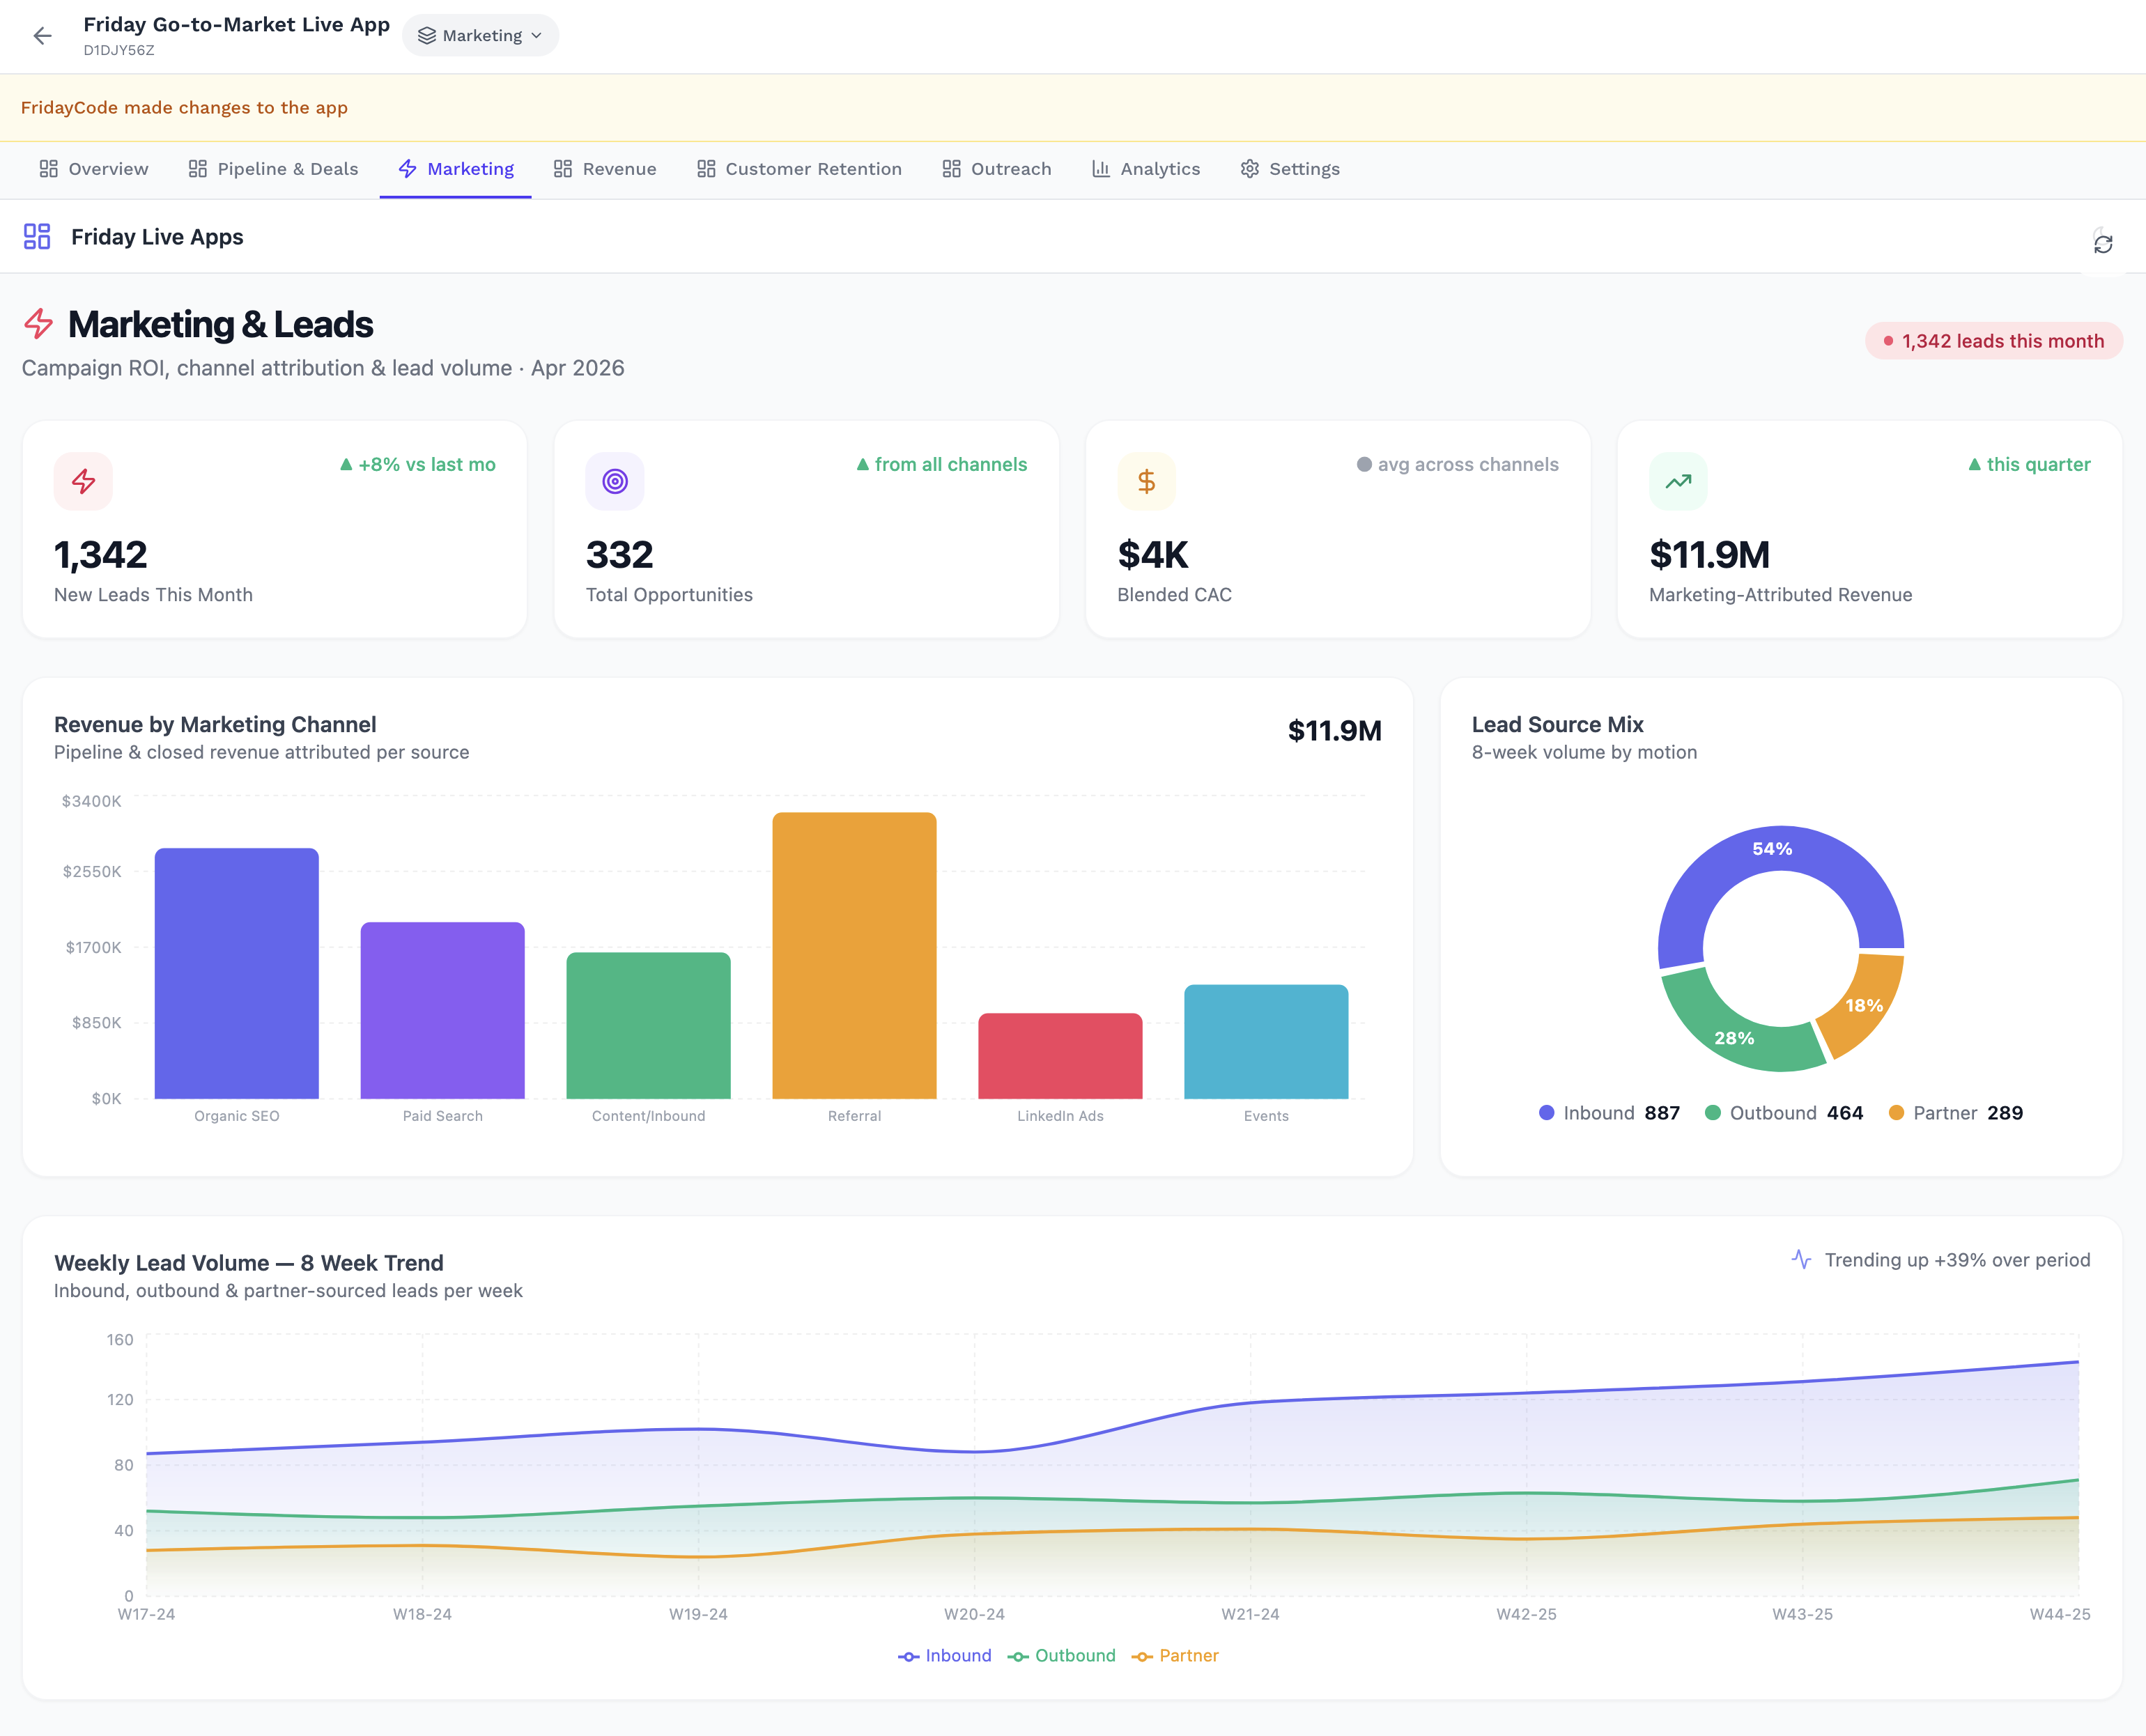
Measure demand generation and lead quality
The Marketing section shows which campaigns, channels, and lead sources are creating real GTM impact. Teams can track new leads, opportunities, CAC, attributed revenue, and source mix to understand where marketing investment is paying off.
Track lead volume, opportunities, and source mix
Measure CAC, ROI, and attributed revenue
Compare performance across marketing channels
Double down on campaigns that create pipeline
Marketing & Leads
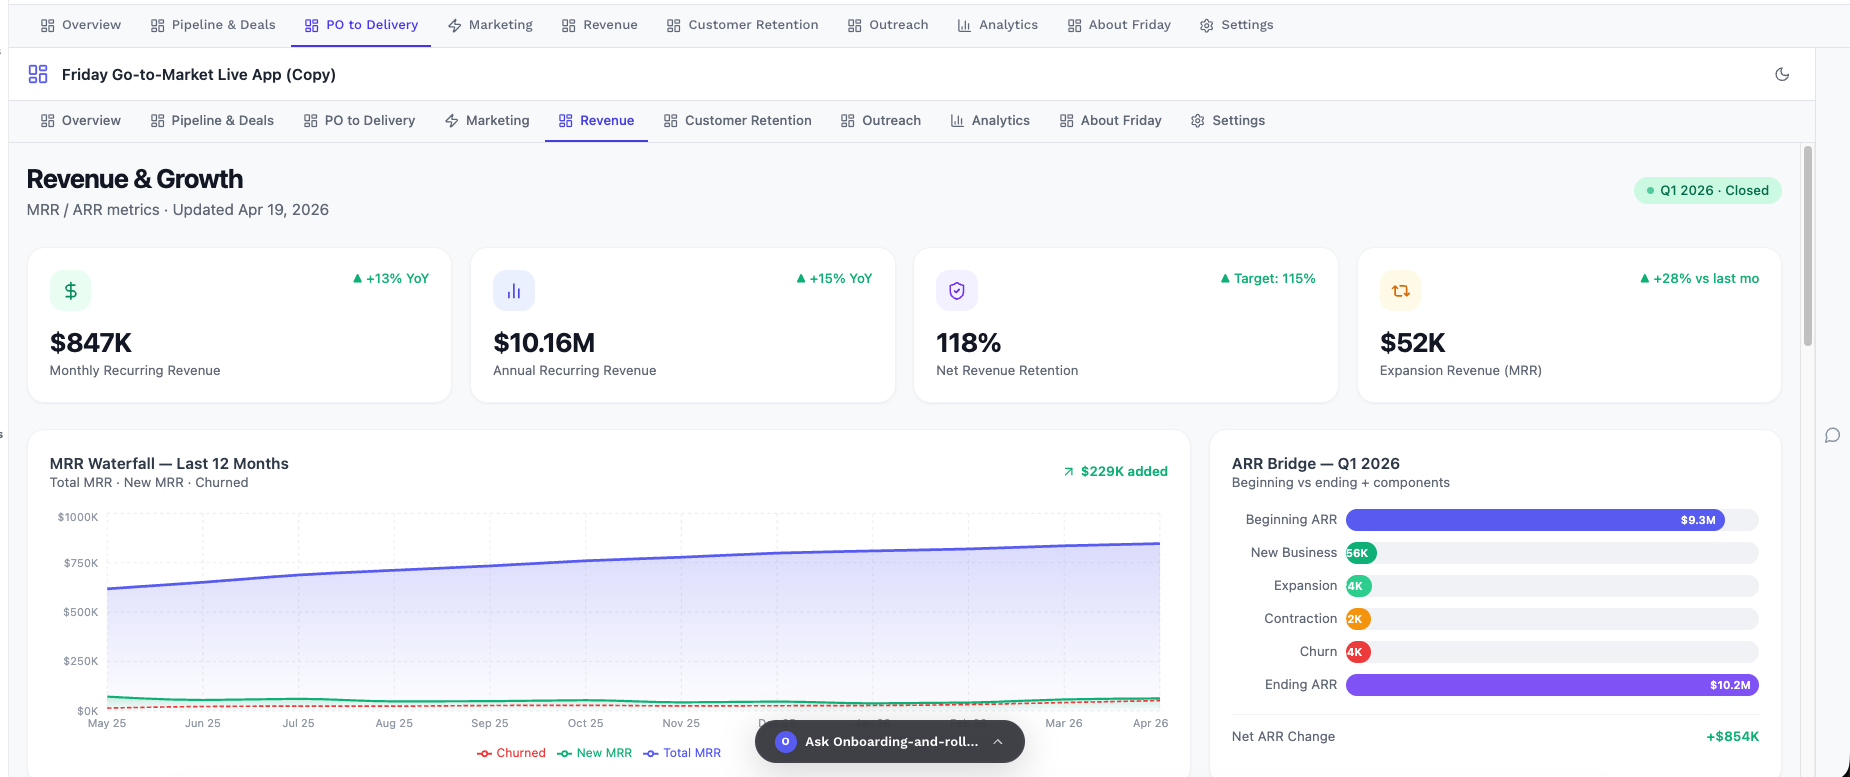
Understand revenue growth and expansion signals
The Revenue section gives teams a clear view of MRR, ARR, retention, expansion revenue, and revenue movement over time. It helps leadership understand whether growth is coming from new business, expansion, retention, or churn control.
Track MRR, ARR, retention, and expansion revenue
Understand revenue movement across time periods
Separate growth from churn and contraction
Make revenue decisions with clearer visibility
Revenue & Growth
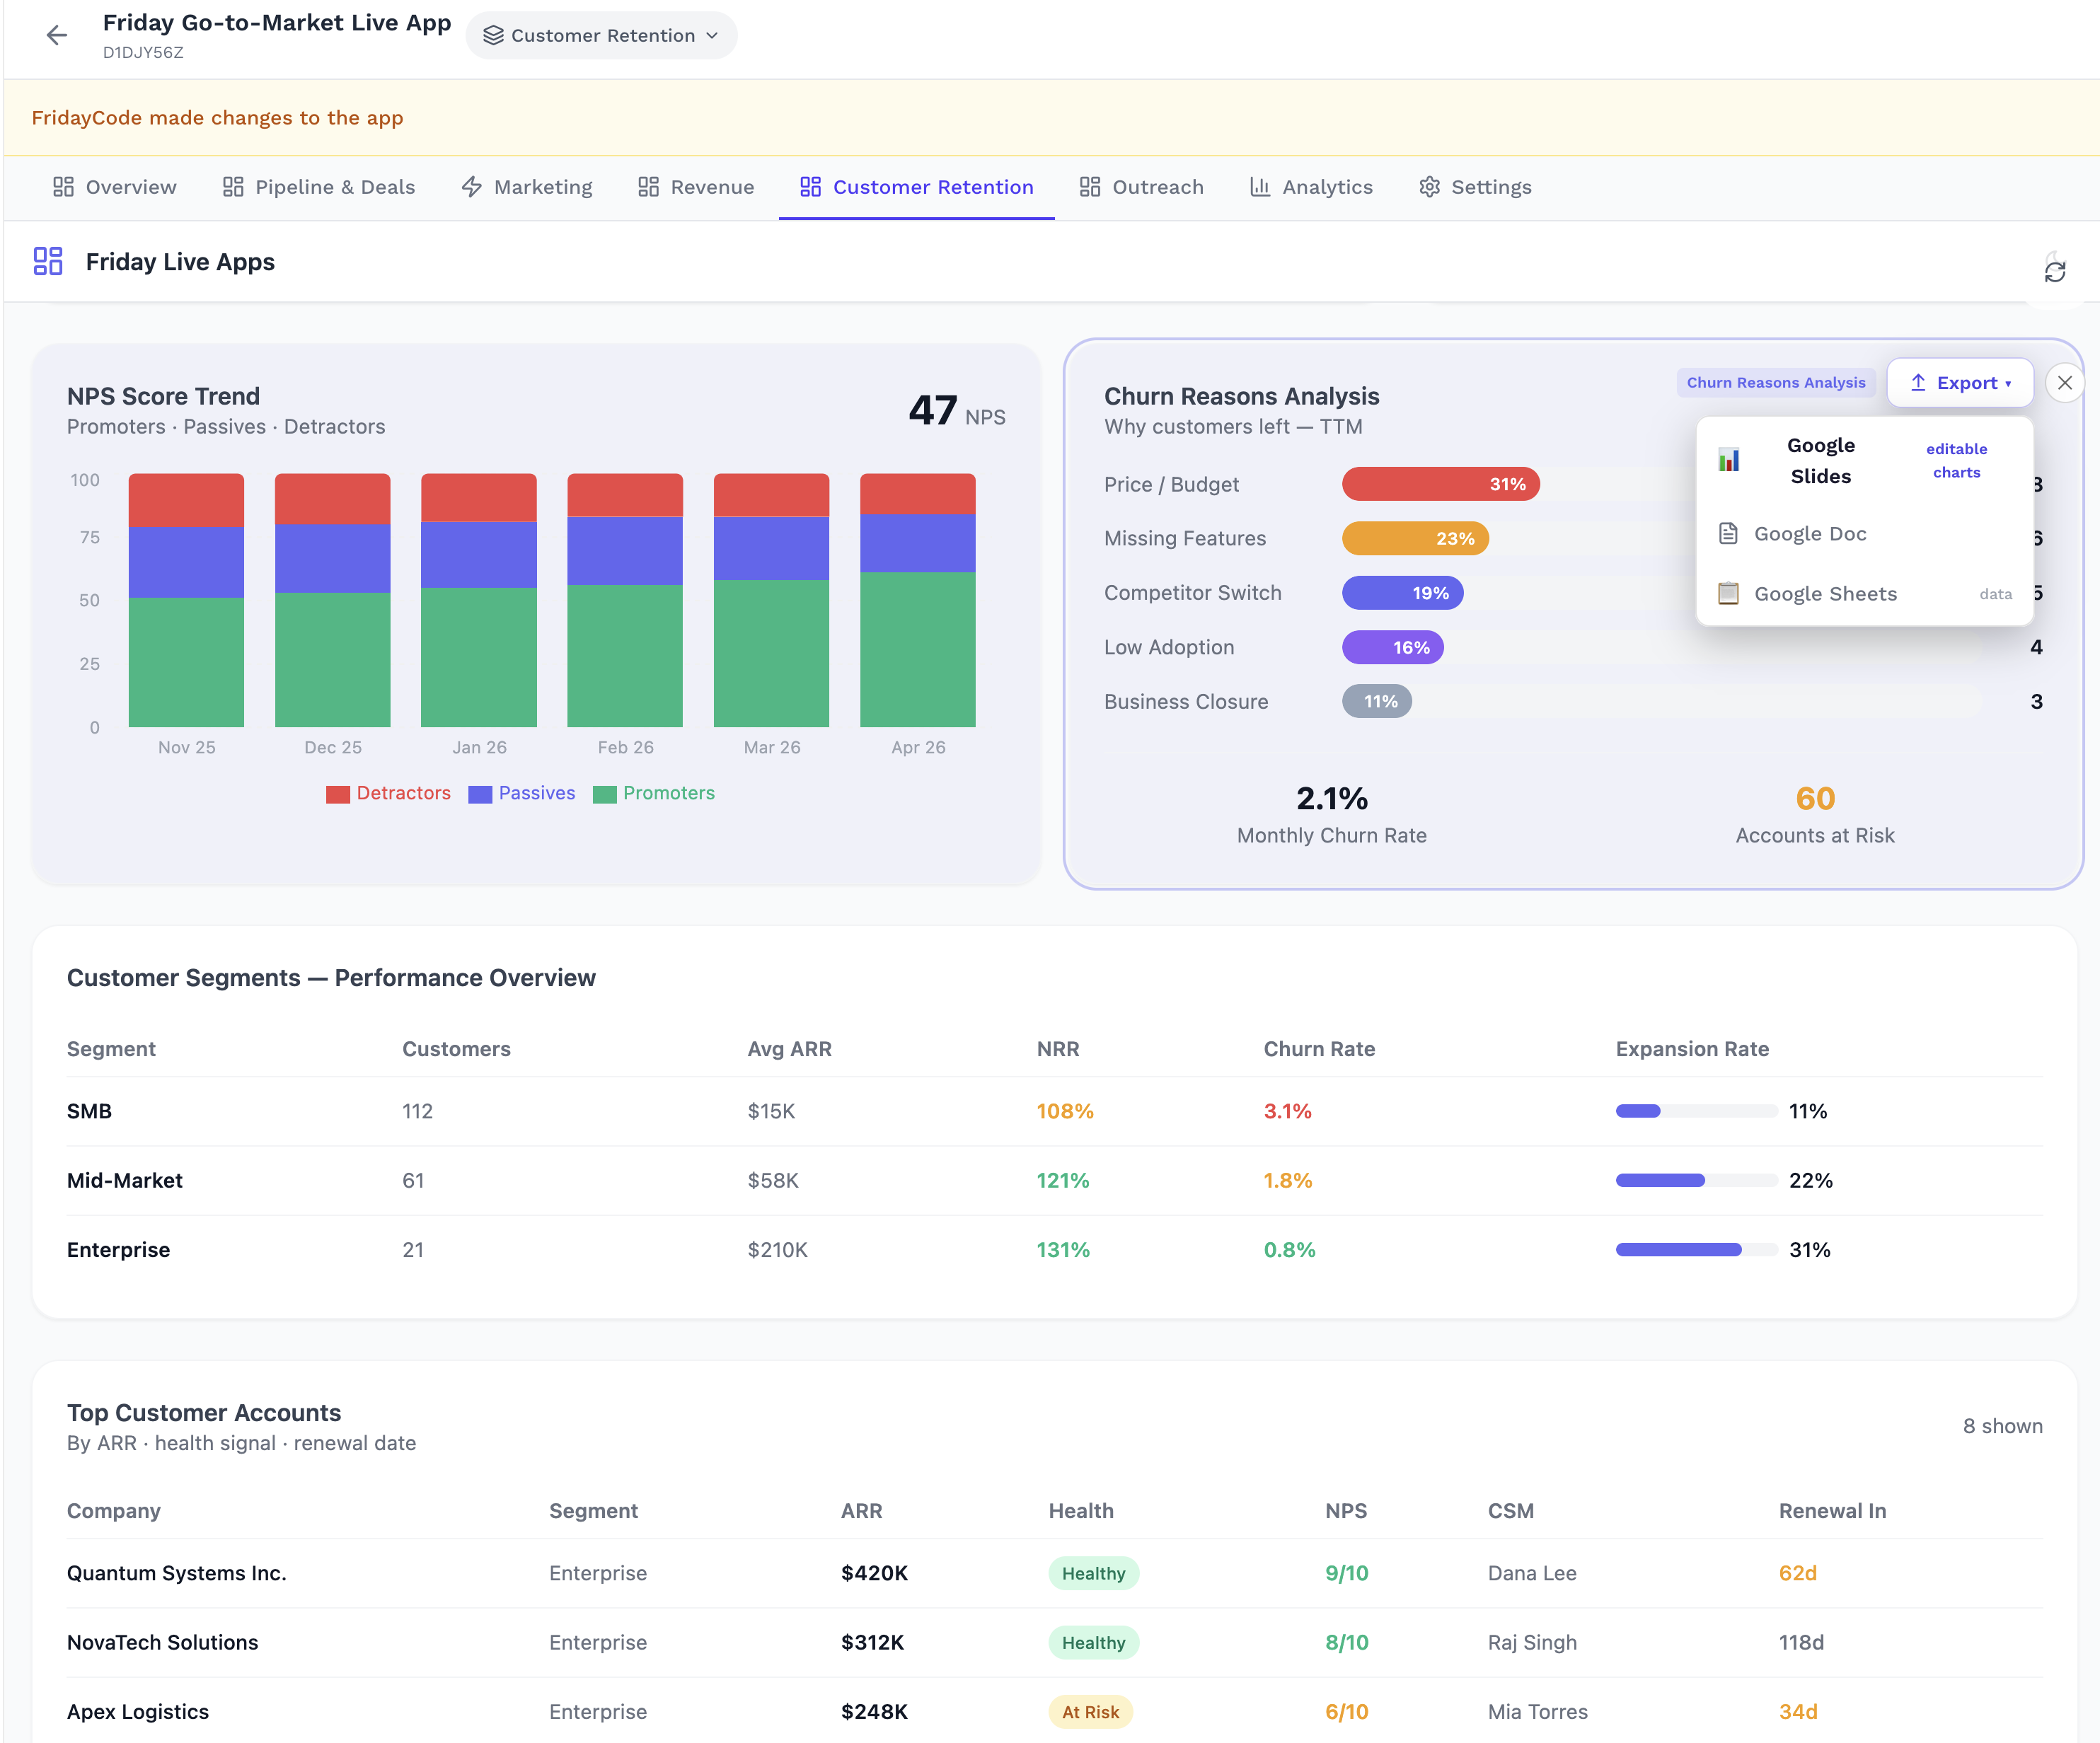
Protect revenue by acting on customer health early
The Customer Retention section helps teams monitor account health, churn risk, satisfaction, renewals, and expansion opportunities. Customer success teams can see which accounts need attention and act before risk turns into lost revenue.
Track customer health and churn indicators
Monitor renewals, satisfaction, and NPS trends
Identify accounts that need proactive follow-up
Find expansion opportunities inside existing customers
Customer Retention
Turn GTM insights into targeted outreach
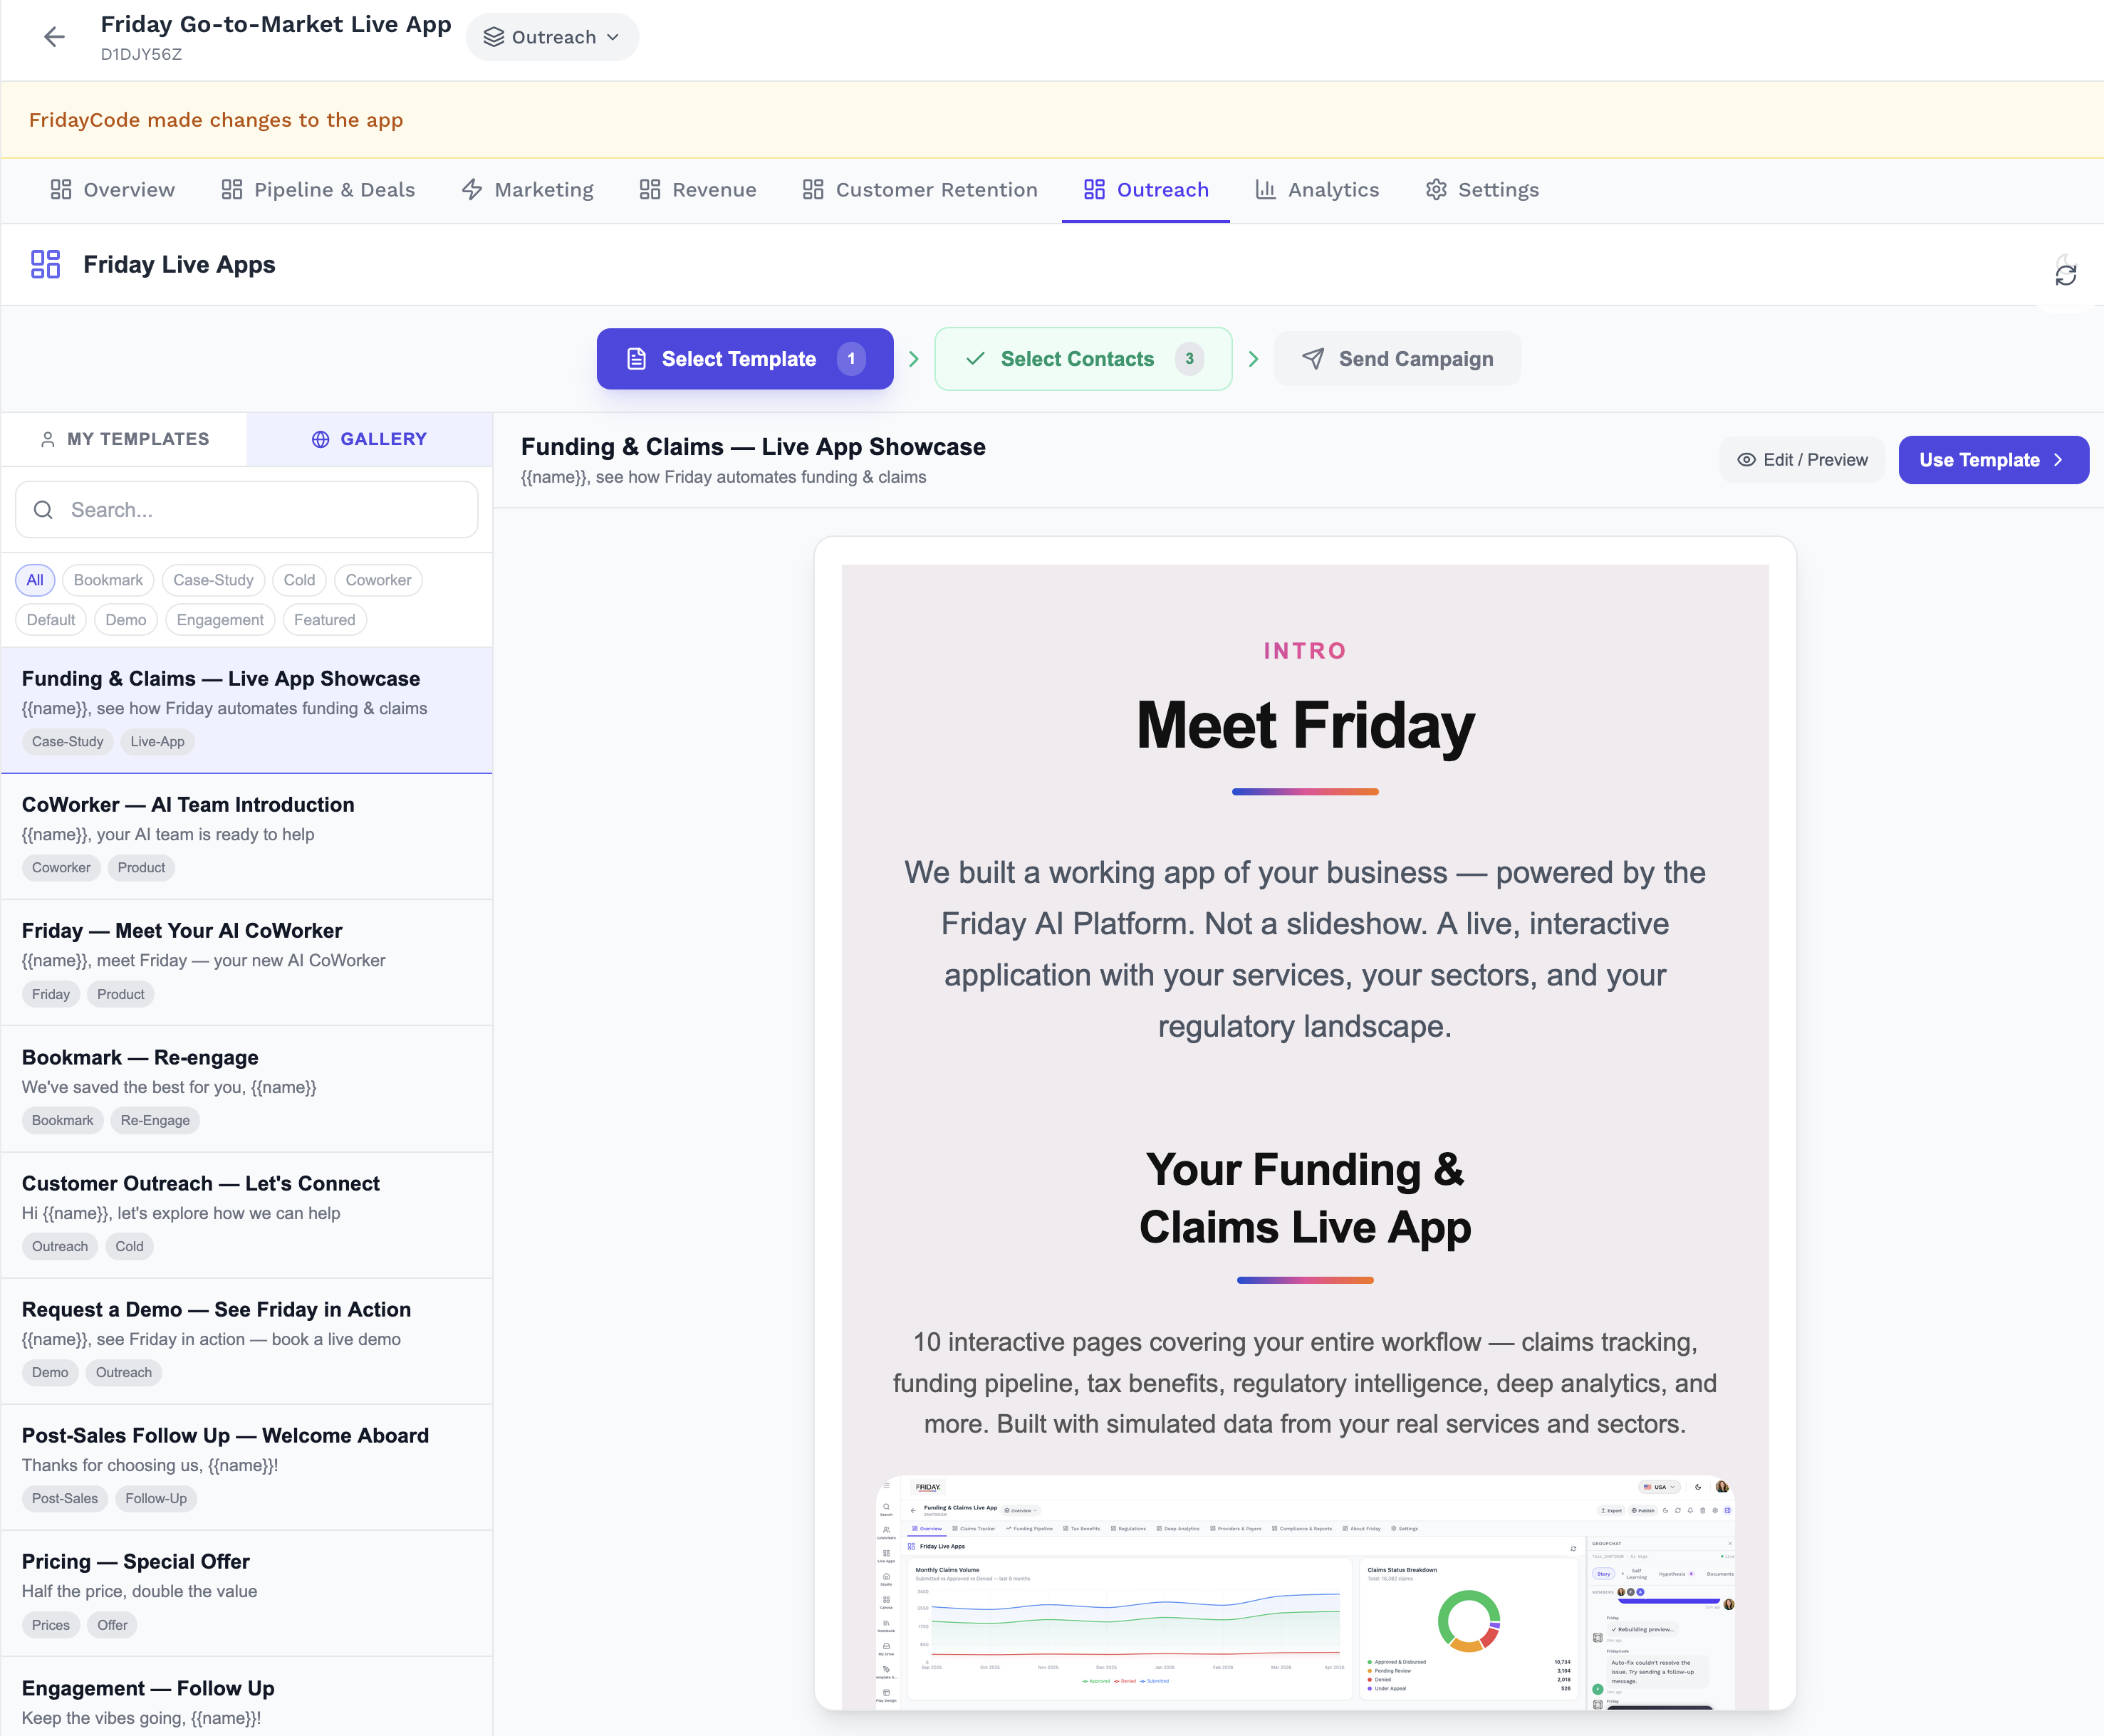
The Outreach section helps teams move from insight to action. Teams can select the right audience, prepare messaging, use templates, and run structured campaigns based on pipeline, marketing, or customer signals.
Create targeted campaigns from GTM signals
Use templates to move faster with messaging
Segment contacts by need, stage, or opportunity
Keep outreach organized from planning to execution
Outreach Campaigns
Turn GTM data into better decisions
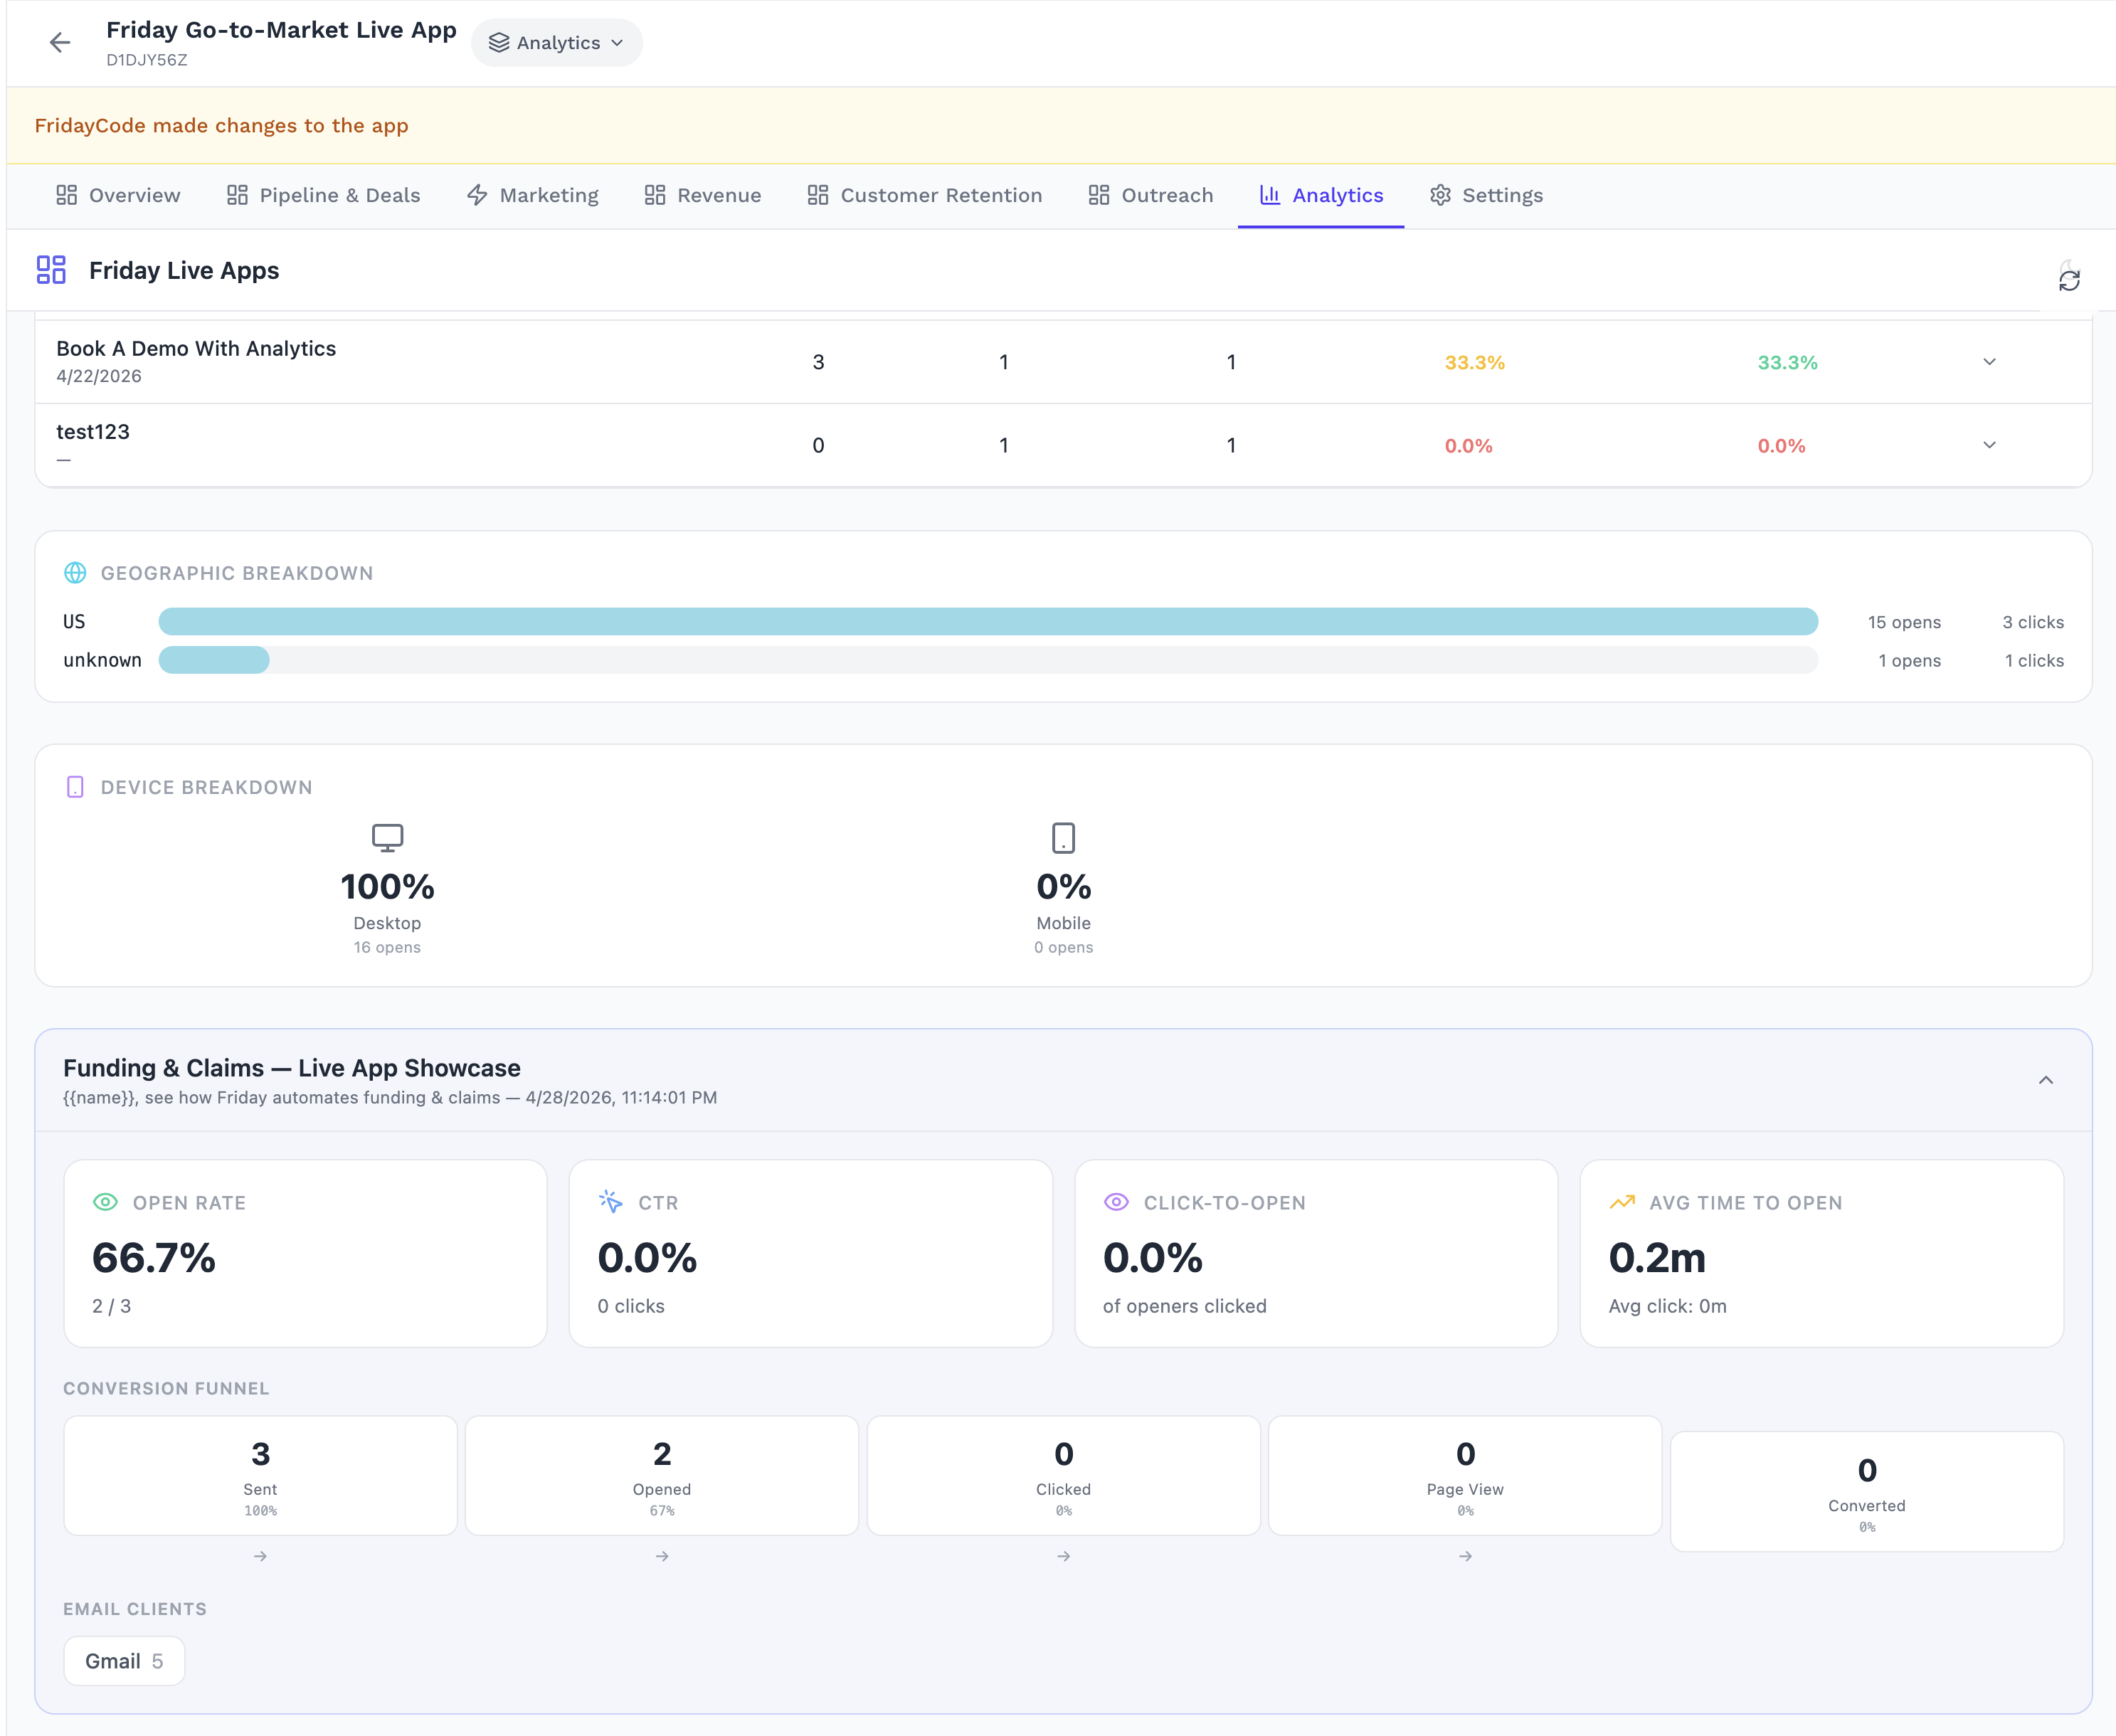
The Analytics section connects performance signals across pipeline, marketing, revenue, retention, delivery, and outreach. It helps teams identify trends, compare movements, understand what is driving results, and decide what to do next.
Analyze performance across the full GTM motion
Compare pipeline, revenue, marketing, and retention trends
Identify what is improving or slowing growth
Use insights to prioritize the next best action
Analytics & Insights